How to Tell If Your Application Is Actually Running Correctly
You just deployed a new version. The pipeline says green. The artifact landed in production. Now what?
When your application only has a handful of users, you can open a browser, click around for a minute, and confirm everything works. But the moment your app serves dozens, hundreds, or thousands of people simultaneously, that manual check stops scaling. There are too many code paths to test, too many users hitting different features, and too little time to verify each one by hand.
The core question is simple: how do you know the new version is actually running as expected after deployment?
What Health Signals Tell You
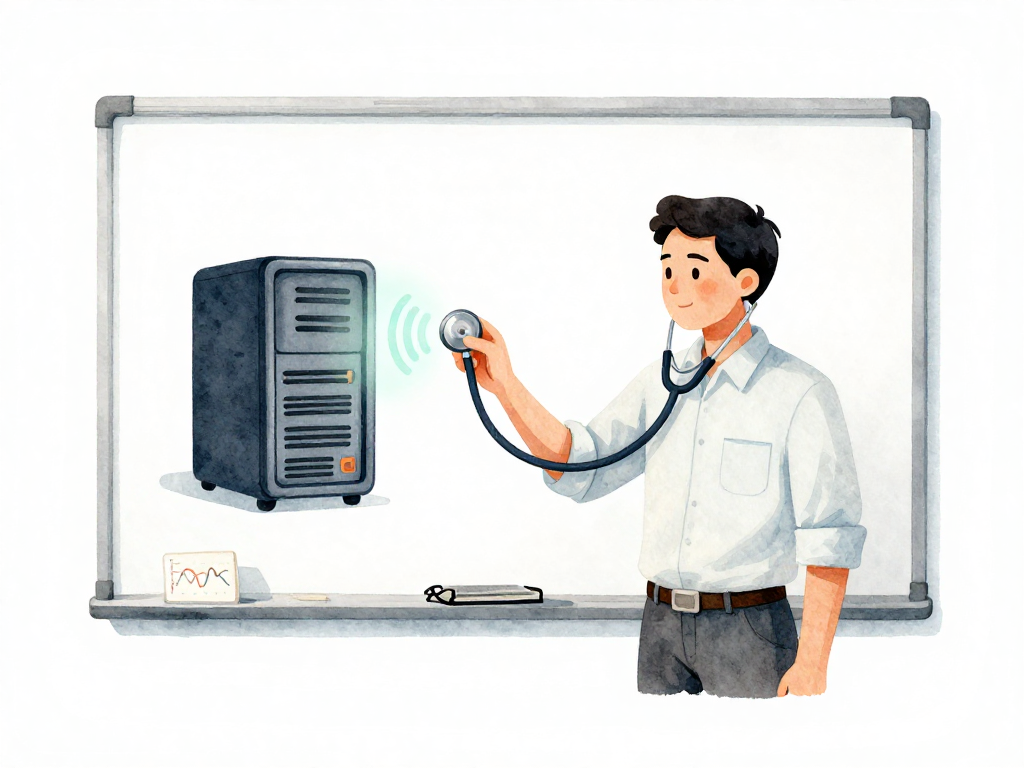
Every running application produces signs of whether it is healthy or not. Think of these as vital signs. A doctor checks pulse and temperature to assess a patient's condition. Similarly, you need signals that tell you whether your application is alive, responding correctly, and staying within acceptable boundaries.
These signals are called health signals. They are the data points that let you determine if your application is functioning normally after a deploy, and continuously while it runs.
Here is a quick way to manually check two of the most common health signals right after a deploy:
# Check if the application's health endpoint responds
curl http://localhost:8080/health

# Expected output (example):
# {"status":"ok","uptime":"2m34s"}

# Search the application log for any recent errors
grep 'ERROR' /var/log/app.log | tail -20
Health signals come from several sources, and each serves a different purpose.
Logs: The Raw Story of What Happened
Logs are the most basic form of health signal. Every time your application receives a request, fails to connect to a database, or finishes processing a job, it can write a line describing what happened. Logs give you a chronological record of events.
When users start reporting errors, logs are often the first place you look. You open the log file or search tool, filter by the time window when the problem started, and trace backward to find what went wrong. Logs answer the question: "What happened right before this error?"
But logs have a limitation. Imagine reading thousands of log lines per minute just to confirm that everything is normal. That is not practical. Logs are excellent for debugging, but they are not efficient for ongoing health assessment.
Metrics: Numbers That Show Trends
Metrics solve the volume problem that logs create. Instead of reading individual events, you collect numerical measurements at regular intervals. Common metrics include:
- How many requests arrive per second
- Average response time
- Percentage of requests that return errors
- Memory usage
- CPU utilization
With metrics, you see trends over time. If response time suddenly doubles, that is a warning sign even if no errors have occurred yet. If memory usage climbs steadily over days, you might be looking at a memory leak that will eventually crash the application.
Metrics let you detect problems before they become visible to users. They compress thousands of events into a single number that you can track and alert on.
Monitoring: Collecting, Displaying, and Alerting
Logs and metrics need to be collected and displayed somewhere you can watch continuously. That process is called monitoring. Monitoring is not just about gathering data. It is about making that data useful.
A good monitoring setup does three things:
- Collects logs and metrics from your application and infrastructure
- Displays them on dashboards so you can see current status at a glance
- Alerts you when something goes outside normal boundaries
For example, you might set a rule: if more than five percent of requests fail within a five-minute window, send a notification. That alert could arrive as a phone notification, an email, or a message in your team chat. The goal is to know about problems before your users tell you.
Why Health Signals Matter Early
The earlier you detect a problem, the faster you can respond. If you only realize your application is broken after users flood social media with complaints, the problem has already been running for a while. In the context of CI/CD, health signals serve as your verification step after deployment. They answer: "Did this release actually work in production?"
Without health signals, you are deploying blind. You push a new version, hope for the best, and wait for someone to complain. With health signals, you know within minutes whether the release is stable or needs to be rolled back.
Health signals also catch problems that appear gradually. A memory leak might take hours or days to cause visible issues. A slow degradation in response time might go unnoticed by users until it crosses a threshold. Continuous monitoring of health signals catches these slow-moving problems before they impact users.
A Practical Health Signal Checklist
If you are setting up health signals for the first time, here is a minimal checklist to get started:
- Pick three metrics to start: request success rate, average response time, and error count. These cover the most common failure modes.
- Set one alert: notify your team when error rate exceeds five percent for five consecutive minutes.
- Check logs after every deploy: even if metrics look fine, scan logs for unexpected errors in the first ten minutes after a release.
- Add a health endpoint: create a simple URL that returns the application status. Monitoring tools can hit this endpoint every few seconds to confirm the app is alive.
This is not comprehensive, but it is enough to catch most problems that happen after a deploy.
The Takeaway
Health signals turn deployment from a blind push into a verifiable process. Logs give you the story of what happened. Metrics show you trends over time. Monitoring connects everything and alerts you when something is wrong. Start with the basics: a few metrics, one alert, and a habit of checking after every deploy. That alone will catch most problems before your users do.